When we talk about inequality, most jump to the thought of income – but this isn’t the only metric. Everything from wealth distribution to the World Happiness Report can be considered, and here are the findings.
Measuring relative inequality on a global scale is a daunting task as while it may be easy to contrast financial situations, quality of life should also be considered, but this subjectivity is hard to measure.
Things like equal access to healthcare and education, quality of life for women and minorities in some countries, freedom of speech – these are all important variables.
Financial
The three key measures of financial inequality are income, consumption and wealth. Typically, most studies into inequality look at income inequality as it is the best-documented and most standardised metric available. However, it may be more prudent to use consumption or wealth.
Consumption tracks income because the living standards of people are based on and can be understood through what they consume. Accumulated capital, or wealth, is also a key factor in living standards.
The Gini index is the most widely used measure of inequality.
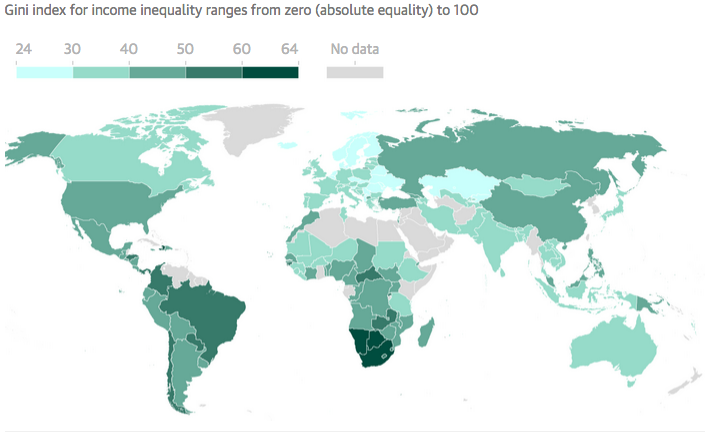 This looks at the distribution of a country’s income or wealth as a whole where 0 represents total equality and 100 represents total inequality. But a major criticism of the Gini index is that it is overly sensitive to what happens to people in the middle, rather than focusing on the extremes, which is a growing cause for concern.
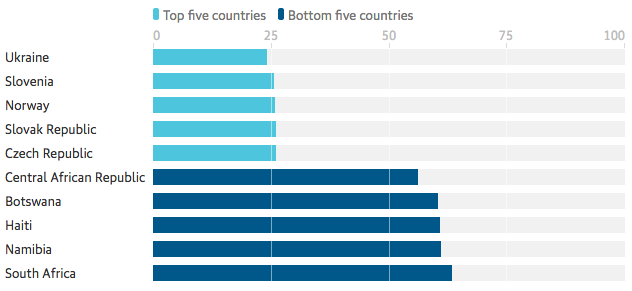
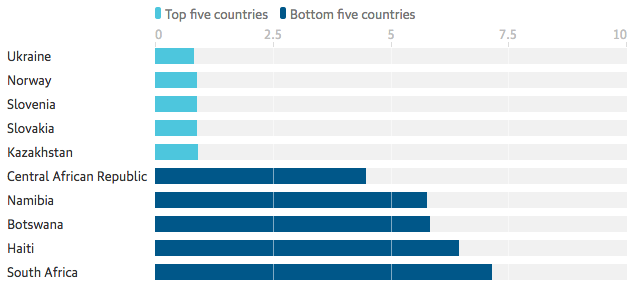
Using the most recent figures, South Africa, Namibia and Haiti are among the most unequal countries in terms of income distribution – based on the Gini index estimates from the World Bank – while Ukraine, Slovenia and Norway rank as the most equal nations in the world.
 An alternative to the Gini index, which focuses on the growing divide between the richest and poorest in society, is the Palma ratio. It focuses on the differences between the very top and bottom income brackets. They take the share of gross national income by the richest 10% of the population and divide it by the poorest 40% of the population’s share.
 According to the Palma ratio figures in the UN Human Development Index, Ukraine, Norway and Slovenia were the most equal countries to live in when considering distribution of income between the richest and poorest in society. South Africa, Haiti and Botswana had the starkest inequalities in income, based on the Palma ratio.
Living standards
When considering other factors aside from income, the range of variables increases and thus a priority is made for people’s access to opportunities and their sense of well-being.
The aim of studies like the World Happiness Report is to show countries that developing policies toward making their citizens happier, rather than just focusing on GDP, is a better strategy.
 The World Happiness Report ranks 155 countries from 1 to 10 in terms of self-defined happiness based on a survey of 1,000 people from each country. Metrics like real GDP per capita, social support, life expectancy and people’s perception of their freedom to make life choices, generosity, and perceptions of corruption.
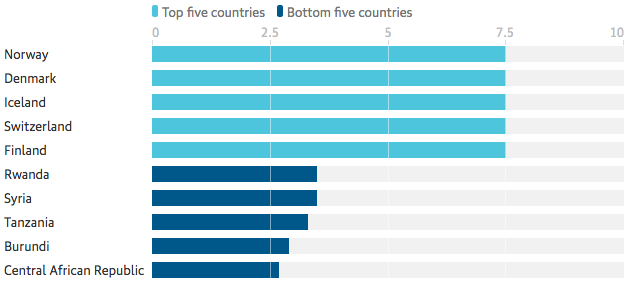
In the latest report the Nordic countries lead the way, with Norway, Denmark and Iceland at the top of the list, while the Central African Republic, Burundi and Tanzania lag behind with low scores in GDP per capita, social support and people’s freedom to makes life choices.
Wealth alone does not bring happiness. The figures from the World Happiness Report show that a high GDP does not always equate with a high happiness ranking. For example Qatar, which has the highest contribution from GDP to its happiness ranking, only sits at 35. Similarly Hong Kong is at eighth and 71st respectively.